Michael Levin | Sunday, May 29, 2011
For the last week, I have been using GNU Screen to help me manage my terminal windows. Although there is a slight learning curve with Screen, there is one major advantage that more than makes up for the extra effort.
Suppose you want to SSH to a computer, start some long-running process, and not have to worry about keeping the connection open for that process to finish. Wouldn't it be great if you could just reconnect later and not only check on the progress, but also have all of your terminal windows in the same state as how you left them?
Here's a similar scenario that I ran into recently. Suppose you're running a script in the background that monitors a folder and compiles CoffeeScript files into JavaScript as the files change. If you simply ran the script from the terminal, the script would need to be restarted every time you closed the terminal window. What if you could start the script once and know it's still running in the background even if you've opened and closed the Terminal application many times since the script was started?
Screen is able to solve both of these problems simply and elegantly. Now, if I ever accidentally close the Terminal application or get disconnected over SSH, the state of all my windows and processes will remain the same. To me, that's a major selling feature.
Is Screen right for you? Here is a simple guide to get you started quickly and help you decide if it fits your workflow.
Getting Started
To get started, simply type screen. The first thing you will see is the startup screen, which you can dismiss by pressing either space or return. I explain how to disable this screen later in the article.
What you see afterwards should look very familiar. It's the same exact terminal you're already familiar with. However, you now have many different options that weren't available before. To see a list, you can view the help by pressing Ctrl-a ? (control-a followed by a question mark).
Creating and Naming Terminal Windows
Screen provides a couple useful ways of managing multiple terminal windows.
While in screen, type the command Ctrl-a " to see a list of open terminals. Currently, you should only have one terminal open, with the number 0 and a default name of the shell you are using. In my case, this is bash. Press enter to go back to your terminal. To rename this terminal, type Ctrl-a A. You should see a prompt appear at the bottom asking you to give the window a title. Call it Terminal 1. If you press Ctrl-a " again, you should see the terminal listed by the title we gave it.
Now, let's create two more terminals and give them different names. The first way to create a new terminal is by typing Ctrl-A c. Rename it one more time by typing Ctrl-a A and calling it Terminal 2. You should now be able to type Ctrl-a " again and see both terminals. You can use the up and down arrow keys or j/k to move between them.
Now let's create one more terminal and name it at the same time. You can do this by typing screen -t "Terminal 3". This will create another terminal named Terminal 3. You can check this by typing Ctrl-a ".
You can also use the -t flag to provide a number for the terminal window. For instance, screen -t "Terminal 9" 9 will create a new terminal window called Terminal 9 with a terminal number of 9. I will show you why this can be useful in the next section.
Navigating Between Terminal Windows
There are a number of different methods for navigating between windows. One simple way is using Ctrl-a n and Ctrl-a p. This simply switches between the previous and next window. Another method is by selected Ctrl-a [terminal-number]. For instance, to navigate to Terminal 9 that we created earlier, you can simply type Ctrl-a 9.
You can also have more than one terminal window open at the same time. To do this, split the terminal window using Ctrl-a S. Once you have split panes, you can easily switch between them using Ctrl-a [Tab]. Once you are in the second pane, you need to select the terminal you want to see in that pane. You can do this using any of the methods described above: Ctrl-a ", Ctrl-a n, Ctrl-a p, or Ctrl-a [term-num]. If at any point you want to exit out of split-pane view, simply navigate to the pane you want and type Ctrl-a Q. If the other pane doesn't disappear right away, it should get overwritten as you keep using the terminal window or you can type Ctrl-L or clear to reset the screen.
One cool feature is that you can use these navigation tools even while you have other programs open within your terminal. Try this example: open up a couple terminal windows and open vi in one of them. You should be able to navigate back and forth between the different terminals without having to close vi.
Detaching and Reattaching Your Screen Session
This is my personal favorite feature of screen. Type Ctrl-a d to detach from your screen session. You are now back to your standard terminal. Type screen -list. It should list that you have one screen session open. Type screen -r to reattach to this session. Once you reattach, you should see that all of the state of your terminal windows has been maintained. If you had more than one screen session open, you would have to provide the process id (PID) following screen -r to select which session you want to reattach.
It's important to note that you don't necessarily need to type Ctrl-a d to detach the screen session to use this feature. If you accidentally close the Terminal application while you have important work open (as I have done many times), you will still be able to reattach and resume your work if you were using screen.
More Tips
Removing the Startup Message
To remove the startup message, add the following line to your .screenrc in your home folder:
startup_message off
If the .screenrc file doesn't already exist, simply create it.
Recognizing Different Sessions
If you want to run multiple screen sessions at the same time, it's important to have a better way to differentiate screen sessions than by PID. To do this, start screen by using the -S flag. For instance, screen -S rubyterms will start the screen session with the session name rubyterm. This name will be displayed when you type screen -list and can be used as an argument to screen -r to start it back up.
Knowing Where You Are In Screen
To view which terminal you are currently using, you can use Ctrl-a i. If you always want to see the terminal you are on and all open terminals by default, add the following line to your .screenrc file:
caption always "%{= Wk}%-w%{= Bw}%n %t%{-}%+w %-="
Setting Up A Startup Configuration
A couple more small edits to your .screenrc can make sure that a few default terminals are automatically created and named for you on startup. Simply add a few screen -t lines in your .screenrc file. Here is an example:
screen -t "server" 1
screen -t "logs" 2
screen -t "ruby" 3
screen -t "coffeescript" 4
Exiting Screen
If you want to exit screen without detaching, you must simply exit all of the open shells by typing exit in each. After the last one is closed, screen will terminate.
Michael Levin | Sunday, May 15, 2011
Having trouble trying to read and debug minified JavaScript in the browser? Don't worry. Newly added pretty printing in the Chrome Developer Tools is here to make it much easier.
For instance, here is a minified script being displayed within the Chrome Developer Tools:
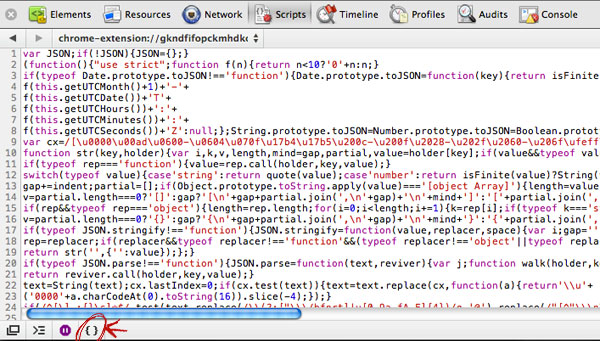
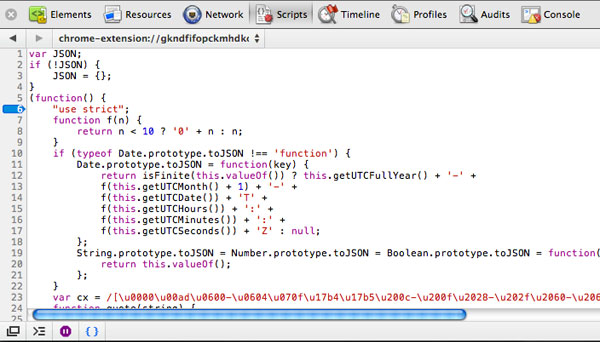
By clicking on the curly brace ("Pretty Print") icon in the bottom left corner, the JavaScript is transformed into something that is both easy for humans to read and easy for setting breakpoints.
This feature is now available in both the Chrome Dev and Canary builds for Mac and Windows.
Michael Levin | Saturday, May 07, 2011
Tracking and improving performance across your website just got a lot easier.
Google Analytics has added the ability to track page load times across all of the pages on your website. The option is not currently on by default, but it can be turned on by adding this method call to your Analytics tracking script:
_trackPageLoadTime();
More detailed information about setting it up and how it works can be found on this Google Analytics help page. Once your tracking code is configured, you will begin seeing statistics on the new Google Analytics site under the Content category.
No user likes to wait around for websites to load. With Google Analytics now providing developers with free and easy access to performance metrics, we can now take a more scientific approach in optimizing page load speeds to improve the user's experience on all of our websites.
Michael Levin | Sunday, May 01, 2011 | Permalink
In his post, Fred Wilson discusses his experiences with investing in companies with new vs. serial entrepreneurs.
The best first time entrepreneurs have been stewing on their idea for quite a while. It is a personal passion of theirs and they bring to it a fresh take, a stubborn insistence on their approach, and they obsess about the idea 24/7. They often get the right product into the market at the right time and they capture the user's attention and usage with that product/market fit.
Where first time entrepreneurs often struggle is when the product works so well that they have to quickly build a company to support the product. Most of the time, the first time founder has not spent anytime thinking about what kind of company they want to build, what kind of people they want to surround themselves with, what kind of culture they want to create, etc. The first time founder often has no experience recruiting, managing teams, and building organizations.
Serial entrepreneurs, on the other hand, often struggle with the founding idea and getting to product/market fit. They start the second and third and fourth company because they love startups and they don't know any other way to work and be productive. But they often lack that passion around a singular idea that drives first time founders.
There are two main components of every successful startup: a good idea and strong execution. When VCs invest in serial entrepreneurs, it's usually early on and the entrepreneur has usually already proven their ability to execute effectively on a good idea.
However, companies started by first time entrepreneurs have yet to prove that they either have a good idea or can execute it effectively. A lot of these companies will fail before ever getting to the stage when they could catch a VC's attention. However, if they make it past this point, they have already proven their idea works in the market and needs the VC for large amounts of capital to scale their idea effectively.
With these two points in mind, it makes sense that serial entrepreneurs need more help with the idea and product/market fit, while the first time entrepreneur needs more help with scaling the business (recruiting, managing teams, etc.).
[via Fred Wilson]
Michael Levin | Wednesday, April 20, 2011
JavaScript code is notoriously difficult to debug. It tends to fail very silently, and even when modern browsers are able to provide errors and line numbers, these sometimes tend to be unhelpful. As web applications are now relying on JavaScript for critical parts of its appearance and functionality, developing a powerful toolkit for debugging and testing JavaScript code is crucial.
Here are some tools I recommend:
Chrome Developer Tools
If you're using Chrome, there are many different tools at your disposal for discovering and debugging JavaScript issues. If something seems to be working incorrectly, simply open up the Chrome Developer Tools console (Cmd-Alt-J on a mac or View -> Developer -> JavaScript Console from the menu). You should see any errors, with associated line numbers, for the page you are currently browsing. You can see similar errors in Firefox by using the Firebug extension.
One new feature in Chrome is the ability to see a stack trace for each error. Just click on the arrow to the left of the error to expand it. This feature becomes more and more convenient as the complexity of your JavaScript program increases, and there are many different paths of possible execution.
Chrome Developer Tools also gives you the power to set breakpoints in your code under the Scripts tab. Simply select the JavaScript file you're trying to debug and click on the line number where you want to set the breakpoint. After reloading the page, Chrome will pause the execution of your script, let you step through it, as well as examine the state of your variables and DOM.
If breakpoints are not your debugging tool of choice, both Chrome and Firefox (with Firebug) support adding debugging statements to your code that get output to the console. To do this, simply use console.debug() and pass the variable you want to examine as a parameter.
Chrome has gone a step further and provided a few new console methods for you to use. One of these is console.assert(). This method is passed some condition as a parameter, which when evaluated to false, will print a complete stack trace. This can be very useful for validating any invariants in your code. Also, if you want to see a stack trace at any point in the program, you can now throw in a call to console.trace(). These new additions to Chrome, as well as some others, were explained in greater detail earlier today in a post on the Chromium blog.
The extensive features in Google Chrome's Developer Tools makes Chrome a very compelling choice for assisting in debugging all of your JavaScript code.
Jasmine
Jasmine is a testing framework for your JavaScript code. While JavaScript has never been a language that has traditionally received a lot (or any) test coverage from most developers, this is slowly changing. JavaScript is a much more serious language today than it was in the past, with the introduction of powerful frameworks, faster browser support, and AJAX. As the code we write becomes more essential to the application, we have a responsibility to make sure it's working correctly.
If you're a Rails or Ruby developer who has played with RSpec, you will feel right at home with the syntax. The Testing JavaScript with Jasmine railscast should get you up and running very quickly.
If you just want to try it out on a simple static site, look at the example provided in the Jasmine GitHub repository. Once you have all the files downloaded, you can just edit the SpecRunner.html file. First, include all of your JavaScript source files, followed by your test files. You should be able to see the results of your tests by simply opening SpecRunner.html in your browser.
JSLint
While JSLint is not necessarily meant for debugging, it is a very useful tool to make sure your code is clean and following best practices. Run your JavaScript through it once you're finished coding to see what it recommends. Certain design choices made in the JavaScript language tend to cause difficult-to-find bugs. JSLint tries to make recommendations that steer you away from making those type of mistakes. If you have trouble understanding any of its recommendations or don't understand the reasoning behind any of them, reading this page should help.
I hope these tips are useful to you. Please let me know if you have any JavaScript debugging tips or tricks of your own.
